EMA Crossover Strategy

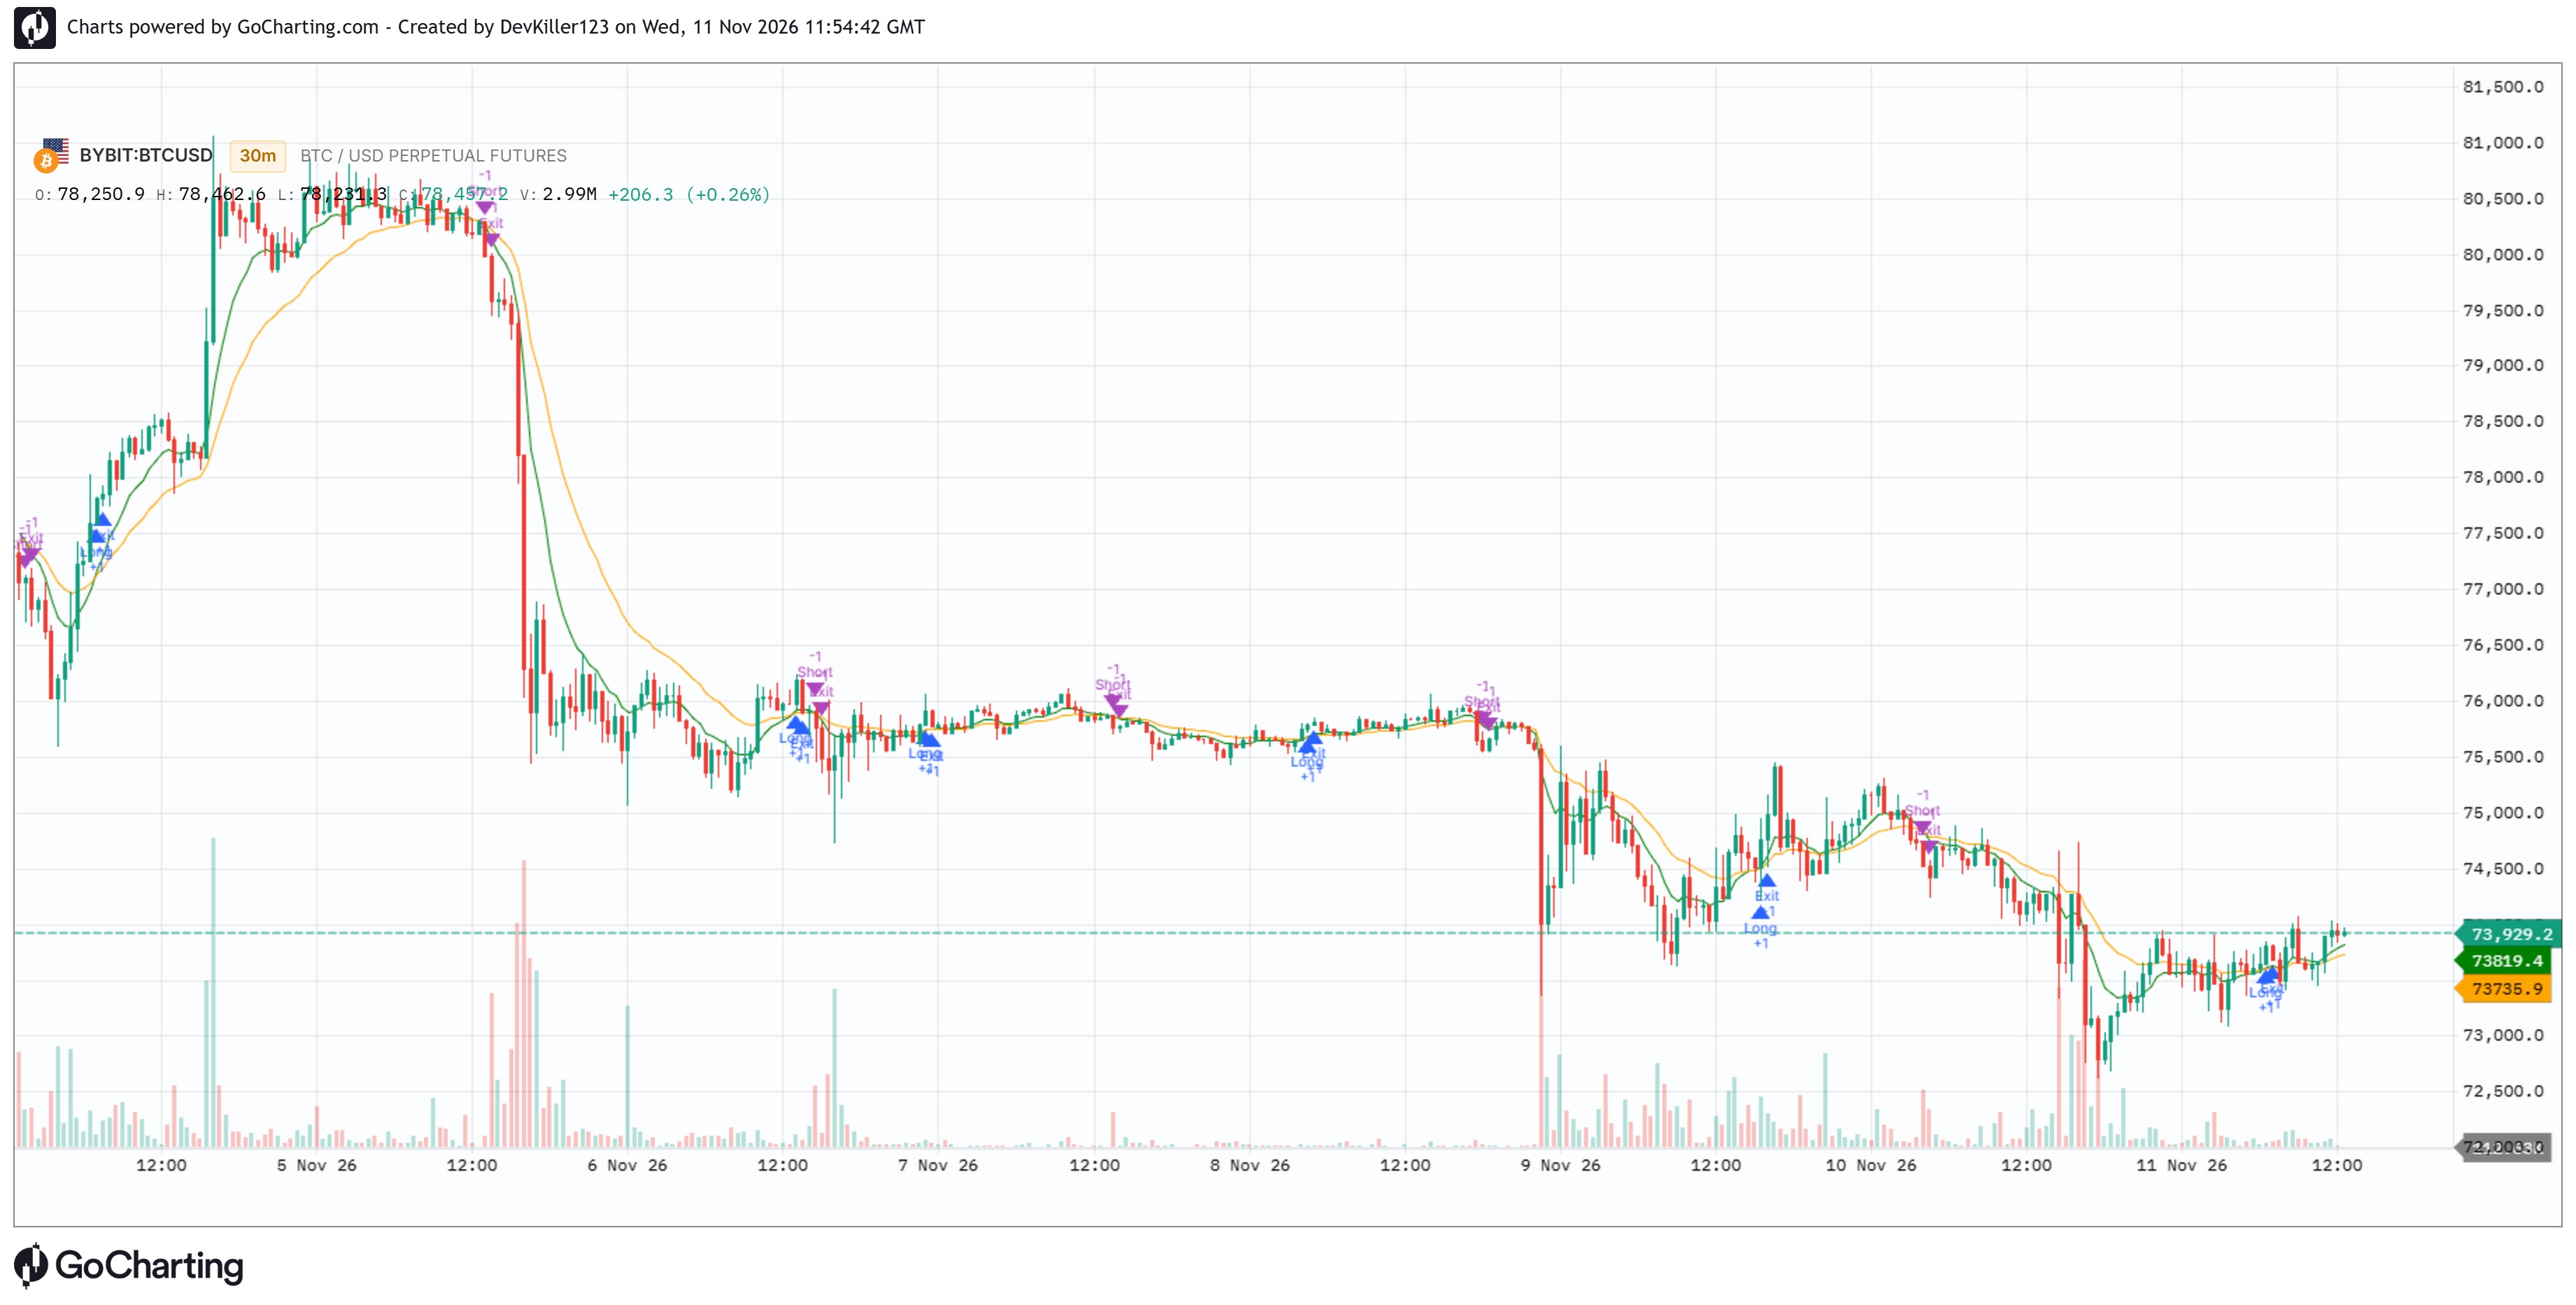
This script's source code is protected by the author.
This strategy calculates two exponential moving averages from closing prices and plots them over the price chart: the faster average in green and the slower average in orange. When the fast average crosses above the slow average, it submits a simulated long entry; when it crosses below, it submits a simulated short entry. An opposite-direction entry can reverse the existing position. Traders can change the fast and slow average lengths, each set to 9 and 21 by default and constrained to values from 1 to 500. No alerts or separate stop-loss or take-profit orders are defined.
The information and publications are not meant to be, and do not constitute, financial, investment, trading, or other types of advice or recommendations supplied or endorsed by GoCharting. Read more in the Terms of Use.
Related Scripts
Comments (0)
Loading comments…