OrderFlow Volume Support and Resistance [BigBeluga]

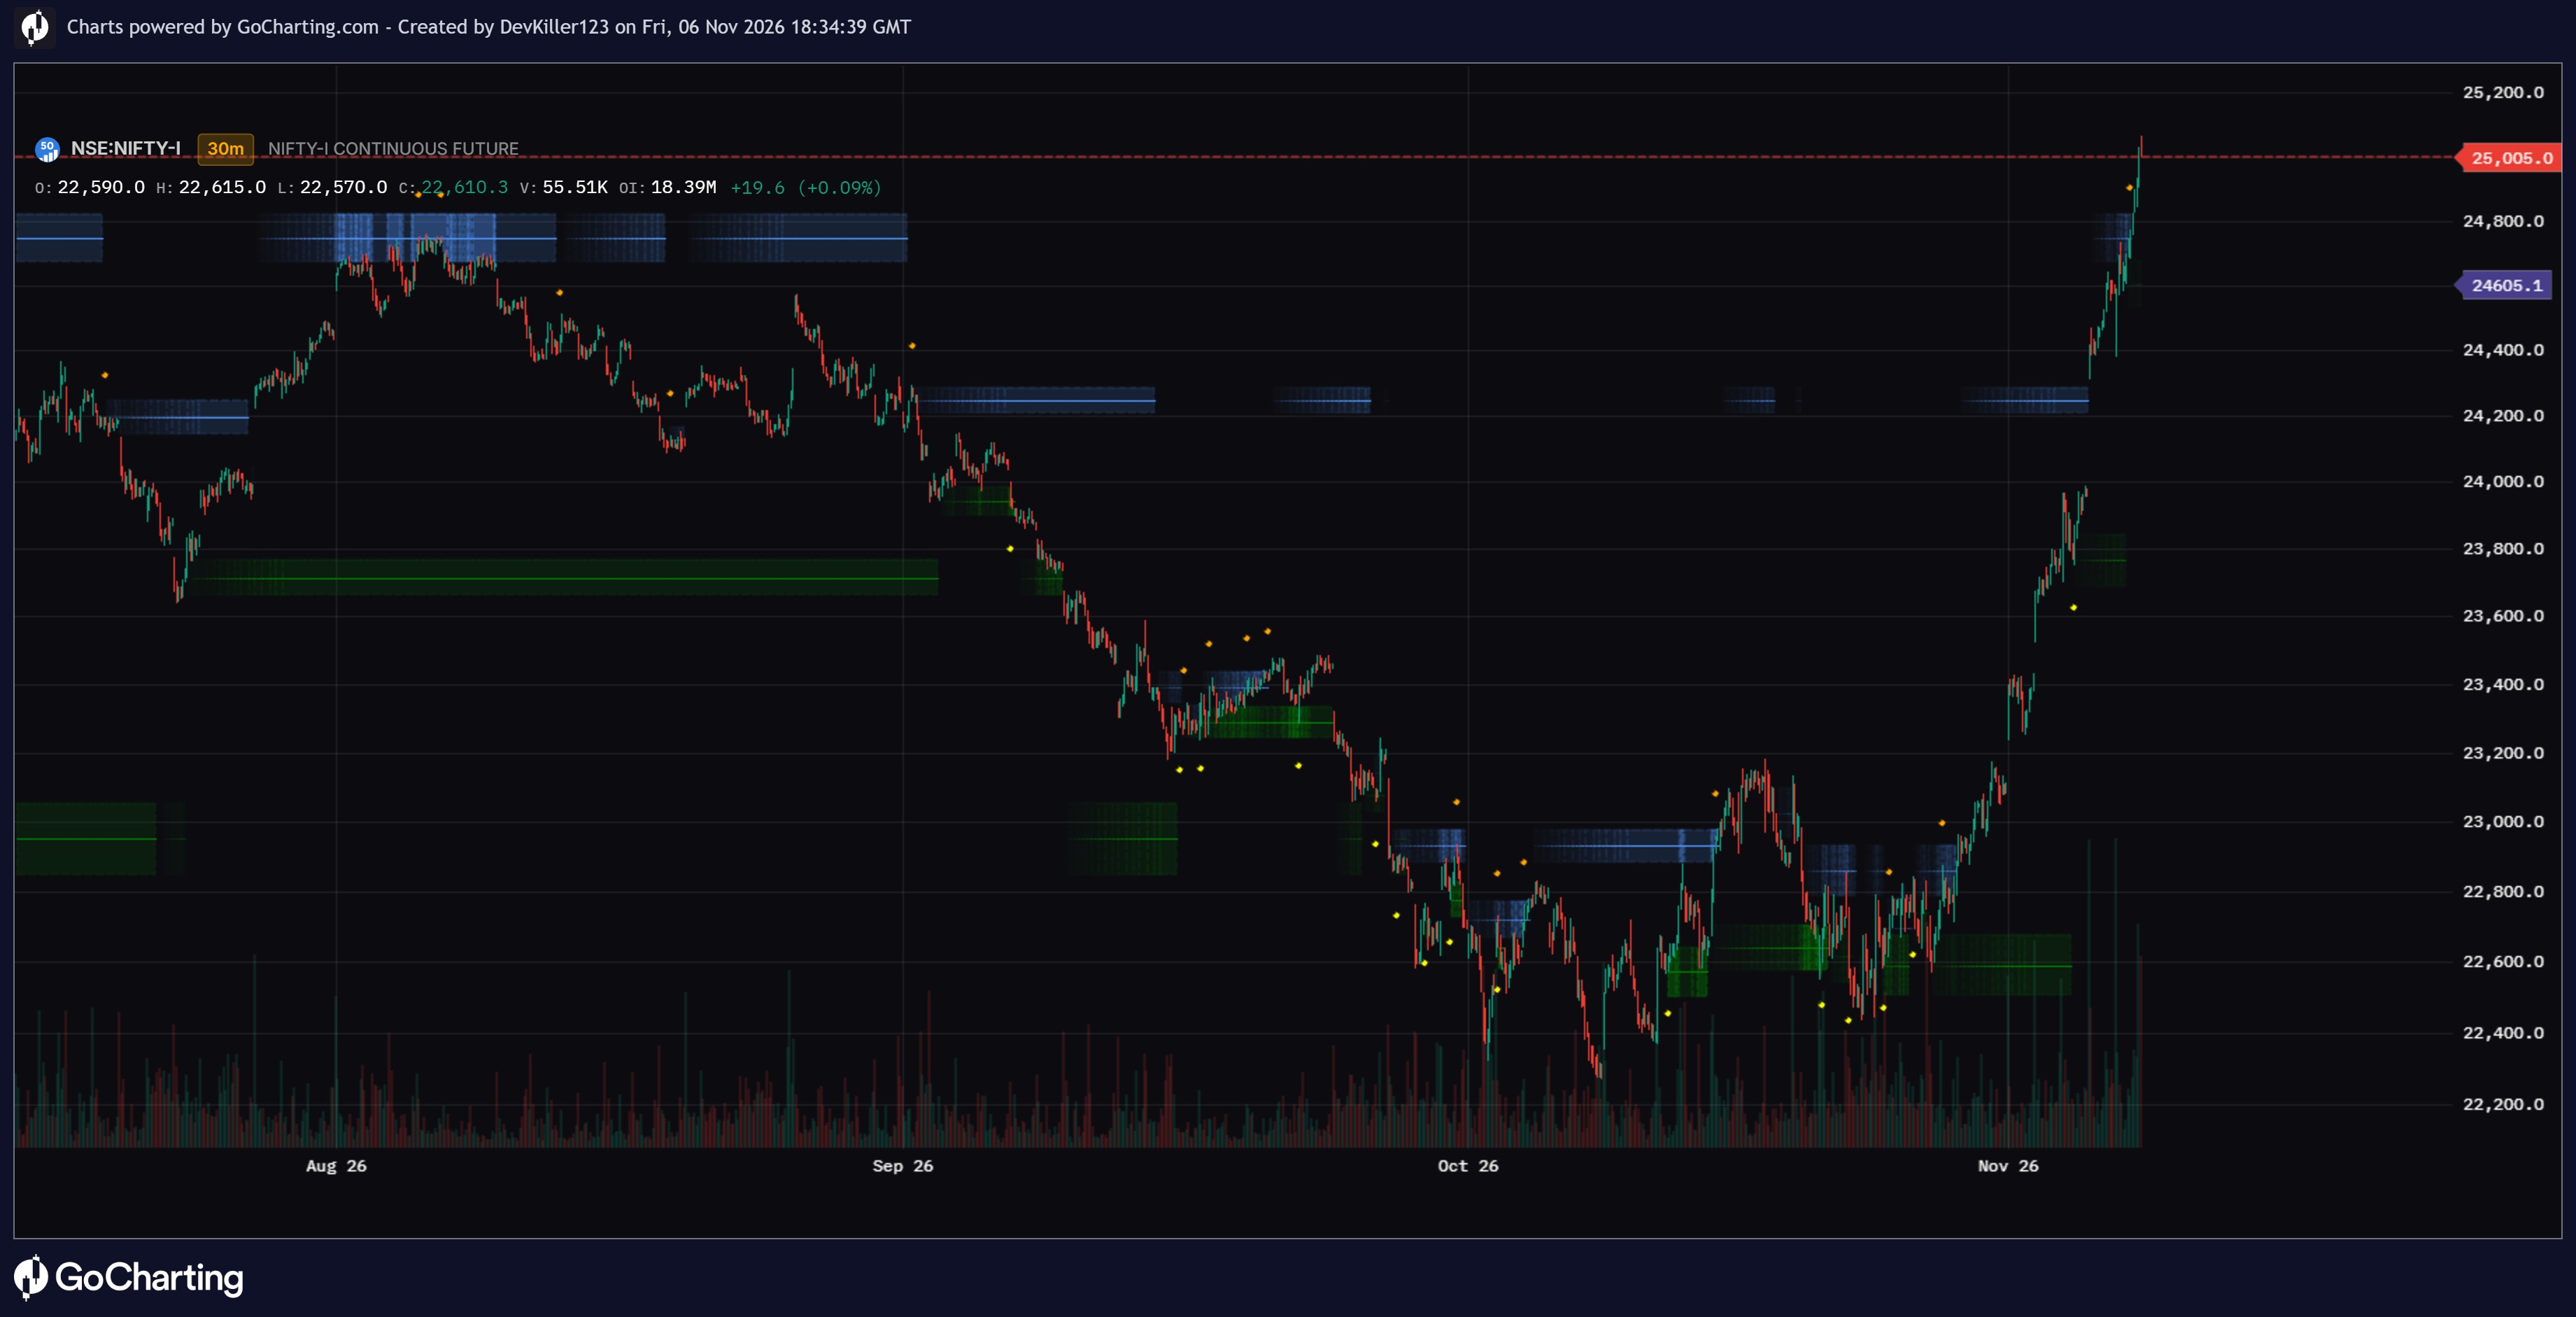
This indicator identifies pivot highs and lows, then forms resistance and support zones around qualifying pivots using average bar range and relative volume. It tracks zones until price closes beyond them, plots their boundaries and optional midlines, and shades the zones with opacity that changes with age and proximity. On the latest bar, boxes show buy volume, sell volume, their difference, and the zone’s volume strength. Diamond markers identify qualifying retests, limited to one mark per zone type within ten bars. Settings include pivot length, separate resistance and support volume thresholds, the offset for information boxes, text sizes, midline visibility, and the two zone colors.
The information and publications are not meant to be, and do not constitute, financial, investment, trading, or other types of advice or recommendations supplied or endorsed by GoCharting. Read more in the Terms of Use.
Related Scripts
Comments (0)
Loading comments…