HKS HEATMAP

This script's source code is protected by the author.
**HKS HEATMAP**
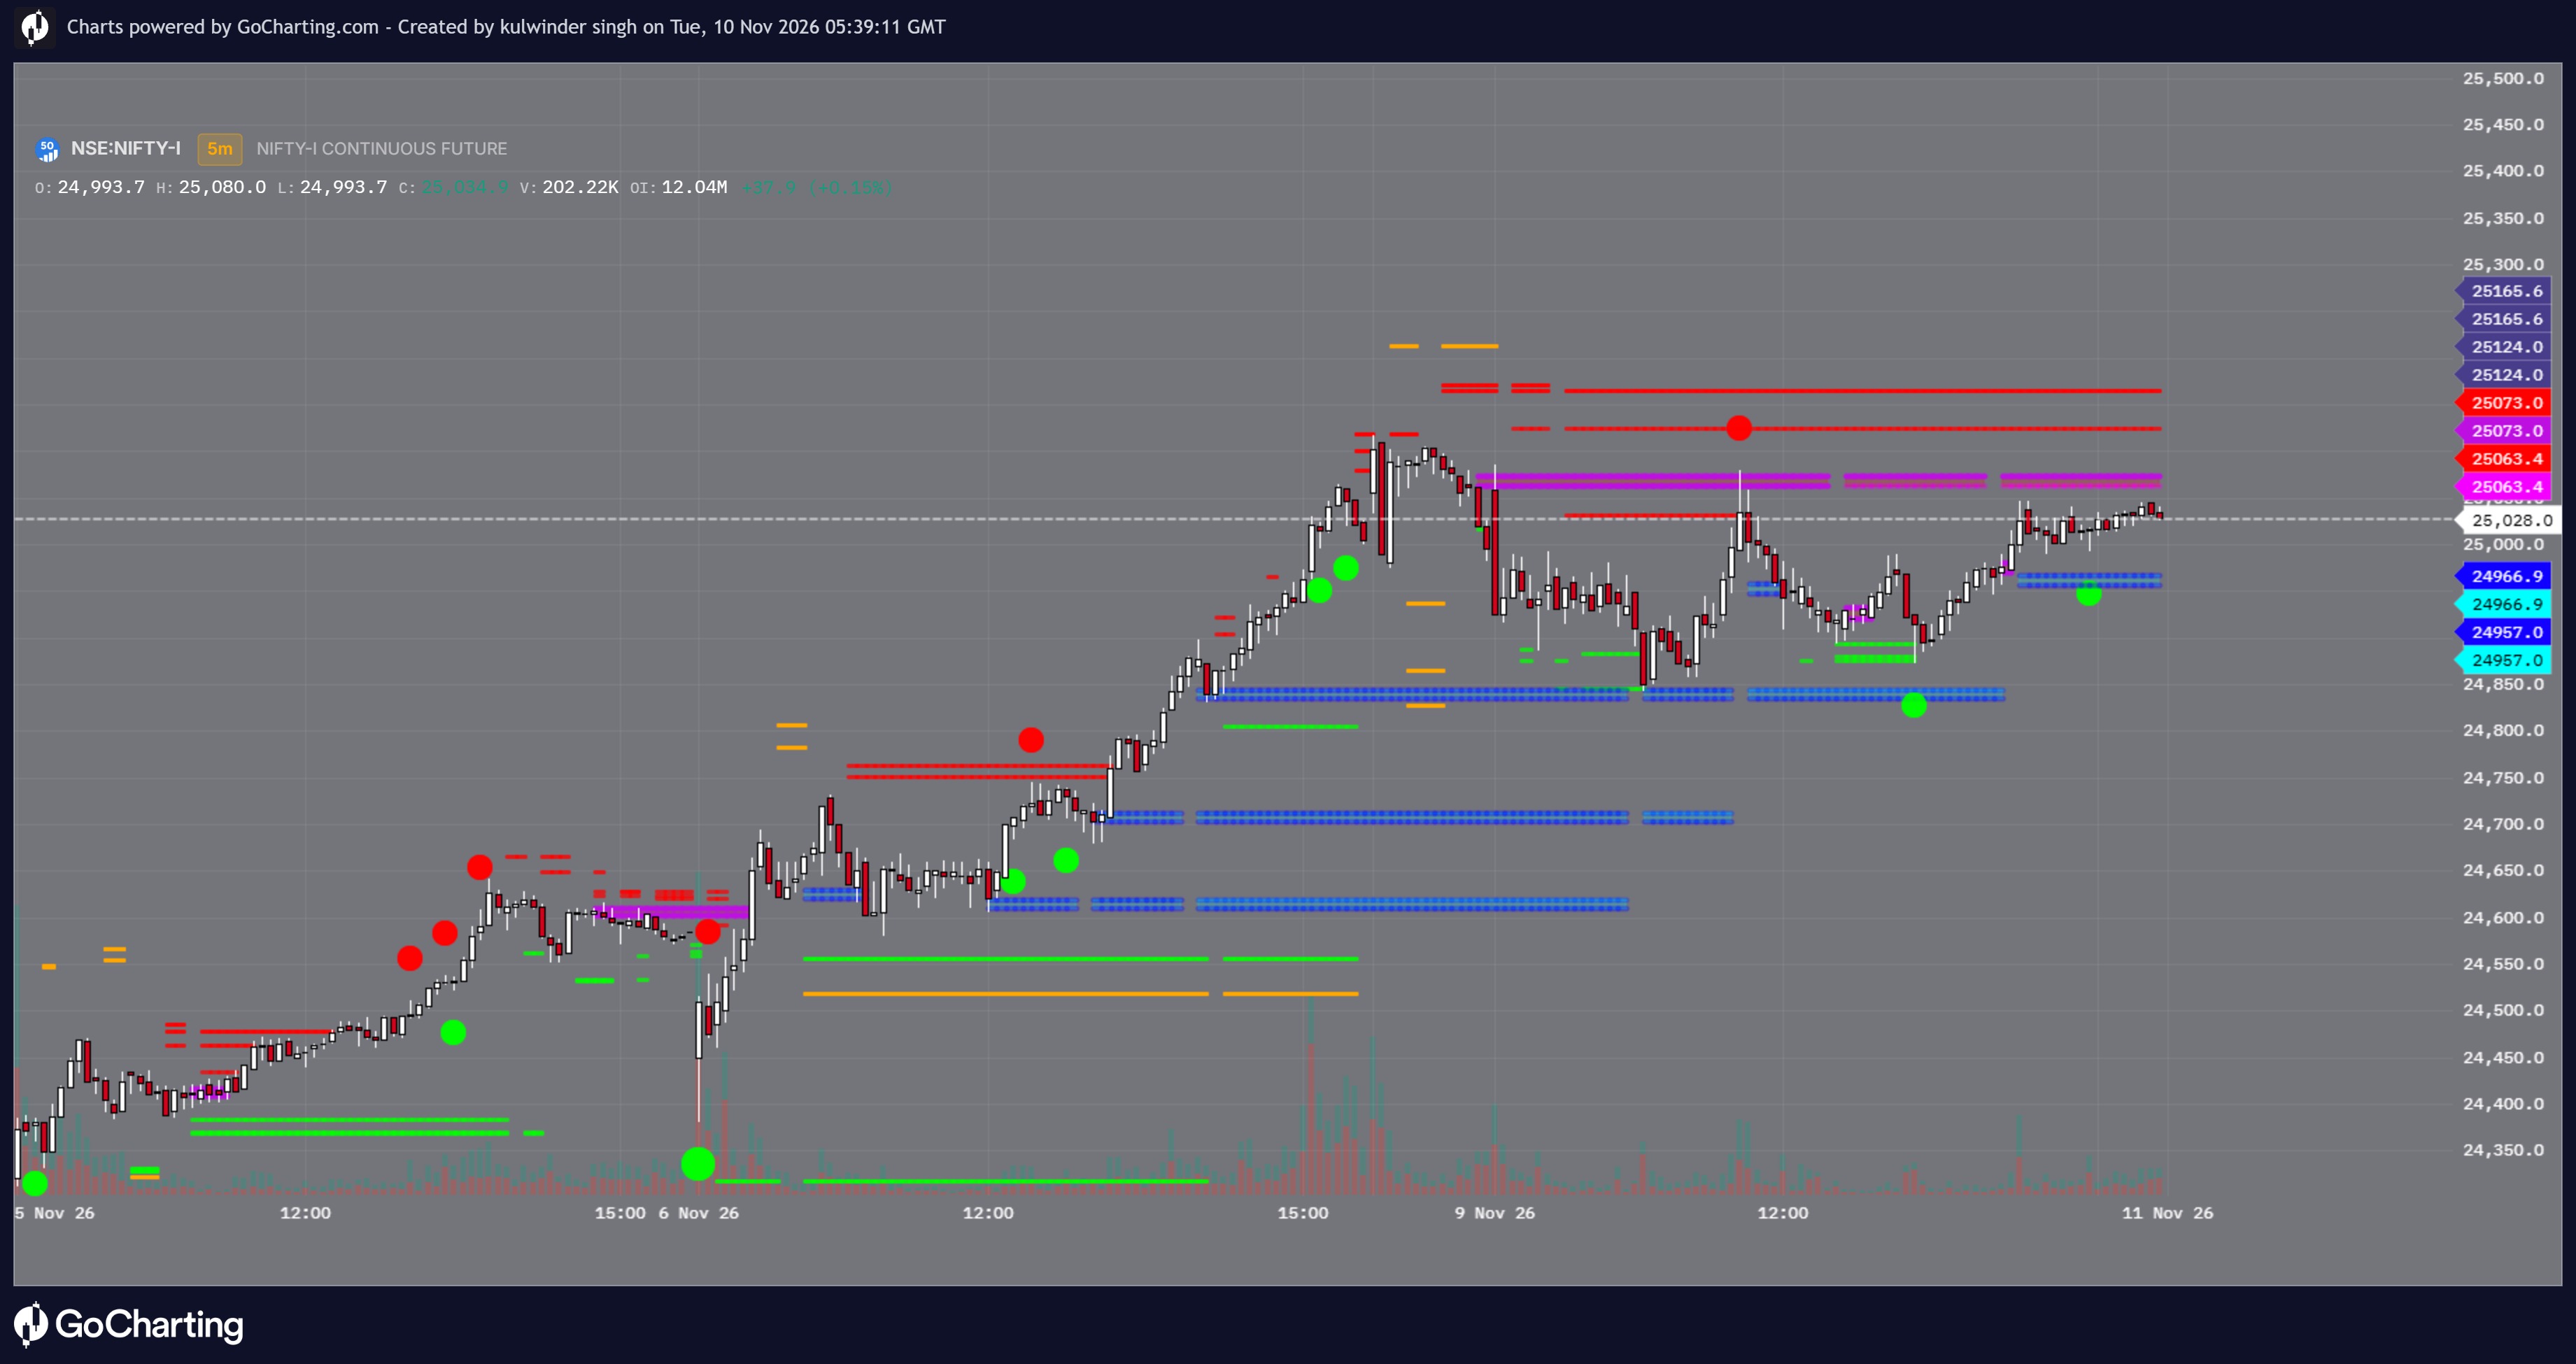
HKS HEATMAP visualizes liquidity concentrations, high-volume buy and sell activity, and potential absorption zones through a color-coded heatmap.
Buy and sell bubbles highlight strong trading activity, helping traders spot areas where aggressive orders may be absorbed. The script also helps track **estimated institutional limit-order activity**, inferred from liquidity and absorption patterns.
These areas can help identify potential support, resistance, and shifts in market pressure. Institutional participation and resting limit orders are estimates—not verified identities or confirmed orders. Signals do not guarantee future price movements.
The information and publications are not meant to be, and do not constitute, financial, investment, trading, or other types of advice or recommendations supplied or endorsed by GoCharting. Read more in the Terms of Use.
Related Scripts
Comments (4)
Loading comments…