← All Analyses BTCUSDT
BTCUSDTawesome

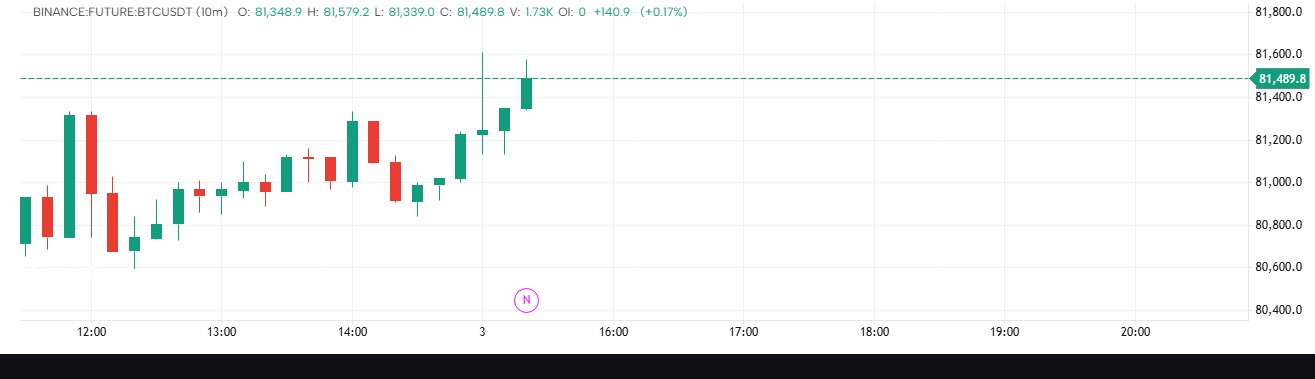
//@version=1
indicator("Awesome Oscillator - Editable", "AO Editable", overlay=false)
// ─────────────────────────────────────────────
// INPUTS
// ─────────────────────────────────────────────
fastLength = input(5, title="Fast Period")
slowLength = input(34, title="Slow Period")
// ─────────────────────────────────────────────
// AWESOME OSCILLATOR CALCULATION
// Median Price = (High + Low) / 2
// AO = Fast SMA - Slow SMA
// ─────────────────────────────────────────────
medianPrice = (high + low) / 2
fastMA = talib.sma(medianPrice, fastLength)
slowMA = talib.sma(medianPrice, slowLength)
ao = fastMA - slowMA
// ─────────────────────────────────────────────
// HISTOGRAM COLORS
// Green = AO increasing
// Red = AO decreasing
// ─────────────────────────────────────────────
aoColor = ao >= ao[1] ? color.green : color.red
// ─────────────────────────────────────────────
// PLOT
// ─────────────────────────────────────────────
plot(
ao,
title="Awesome Oscillator",
color=aoColor,
style=plotStyle.histogram,
linewidth=3,
histbase=0
)
Disclaimer
The information and publications are not meant to be, and do not constitute, financial, investment, trading, or other types of advice or recommendations supplied or endorsed by GoCharting. Read more in the Terms of Use.
Comments (0)
Loading comments…